Mastering Portfolio Analysis: Unlocking Business Potential with BCG and Pareto Tools
Explore the essentials of Portfolio Analysis with our concise guide. Learn how BCG and Pareto Analysis can revolutionise your business strategy.
Contents
What is Portfolio Analysis?
Some businesses are simple. They offer a single product or service. Others are more complex. They offer multiple products or services.
Portfolio analysis helps you to understand and analyse businesses which have a portfolio of products or services.
StratNavApp.com provides two tools specifically designed to help you with Portfolio Analysis:
- BCG Analysis
- Pareto Analysis
BCG Analysis
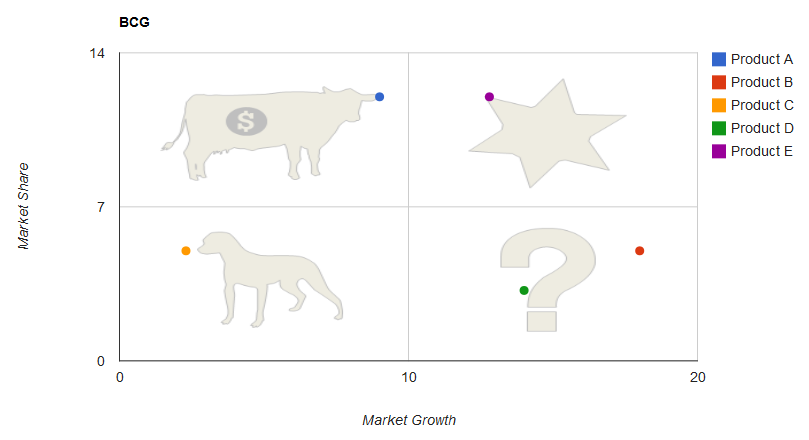 BCG analysis plots each product or service according to its market growth rate and market share.
Using these two dimensions, products and services can be categorised as:
- Dogs: Low growth rate and low market share.
- Question Marks: high growth rate and low market share.
- Cash Cows: high market share and low growth rate.
- Stars: high growth rate and high market share.
The categorisation of each product and service then has implications for the strategic choice you might make for each.
You can learn more here.
Pareto Analysis
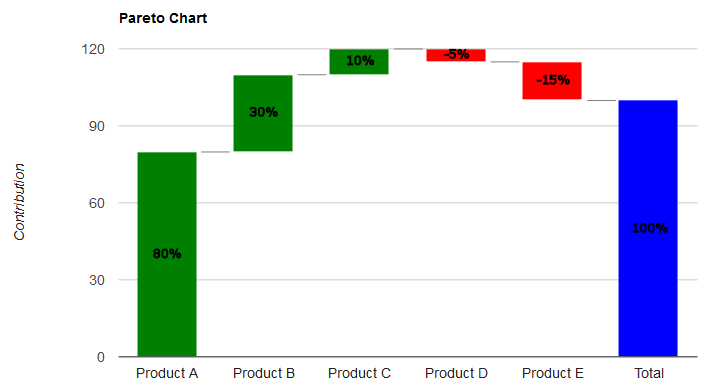 The pareto principle states that 80% of effects are caused by 20% of causes.
This has many applications. 80% of profit comes from 20% of customers. 80% of costs come from 20% of problems. Logic tells us that by focusing on the 20% of causes which cause 80% of the effects, we can make the most difference.
In this case, we consider that 80% of profit contribution comes from 20% of products or services.
Our Pareto Analysis tool will help you to see if that is true or not, and which the 20% is.
You can learn more here.