Home > Articles > Frameworks
Pareto Analysis
Pareto Analysis helps you identify where 20% of efforts drive 80% of results. Learn how to apply the 80:20 rule in business strategy with StratNav.
The Pareto principle is also known as the 80:20 rule. It says that 20% of the causes produce 80% of the effects. You can apply it in a wide variety of strategic analyses.
The most common application is that 20% of a business' clients produce 80% of the profits. Closely related to this is that 20% of a business' products/lines produce 80% of the profits. But other applications can also add significant value. For example, in The Good Enough Revolution: When Cheap and Simple is just fine, Wired Magazine suggests that customers may attribute 80% of the value of a product to 20% of its features. They suggest that most customers of Microsoft's Office programmes use only 20% of the product's features. And so they are increasingly turning to less fully-featured office solutions, such as Google Documents. These offer fewer features, but other advantages.
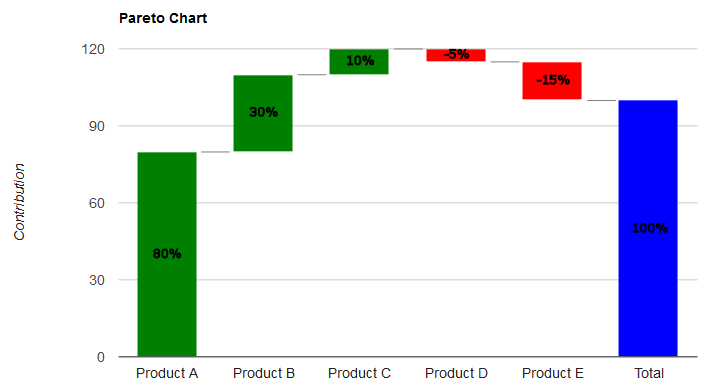
Of course, 80:20 is just a figure of speech. The numbers could be anything. They don't even need to add up to 100%, and neither are they limited by 100%. So, it could be that 15% of the products produce 110% of the profits. In this example, it follows that the remaining 85% of products contribute a 10% loss. (This brings the combined profit back down to 100%.)
Pareto analysis involves identifying and attributing the value created (the outputs) to the inputs. It is often charted in the following manner:
 Good Pareto analysis relies on a cost accounting system, such as an Activity-Based Costing (ABC) system for data, in order to achieve this attribution.
Pareto analysis can help a firm make decisions about where to apply resources and focus. It is particularly useful in identifying loss leaders. These may then be:
- exited if they have low strategic value, or
- remediated if they have greater strategic value.
I am often told that loss leaders must be sustained simply because they contribute to overhead and fixed costs. But this logic does not stand up if you consider that all costs are variable in the long run. However, loss leaders may make sense where they attract customers who subsequently buy more profitable products. It is also useful for firms that have lost direction and are looking for a focal point around which to reposition themselves in the market.
Pareto charts, like the one shown above, can be difficult to draw. They are not easily supported by common charting tools like those bundled into MS-Excel. Fortunately, StratNavApp.com can help you draw Pareto charts. StratNavApp.com is the free, innovative and collaborative tool for developing and executing business strategies. I drew the chart above in StratNavApp.com. Why not try it now?
See also:
(The Pareto principle is named after Vilfredo Pareto. He observed in 1906 that 20% of the population owned 80% of the land in Italy.)
