Home > Articles > Frameworks
Using the Gantt chart view
The Gantt chart view shows a familiar timeline of your strategic initiatives.
Contents
 The Gantt chart view shows a familiar timeline view of your strategic initiatives.
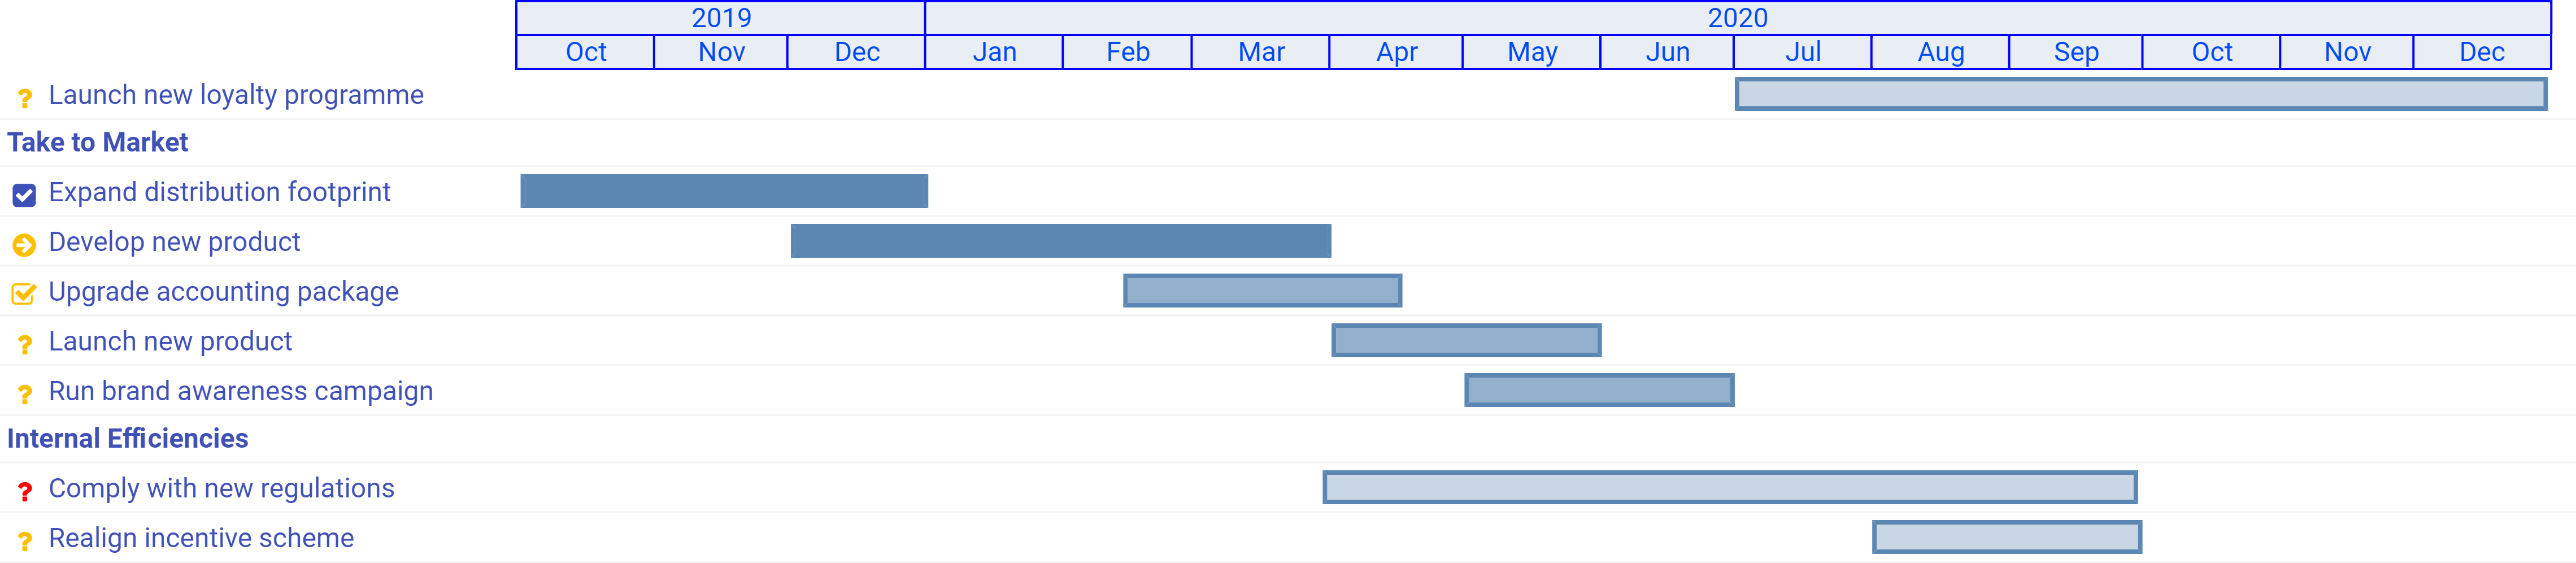
You can see an example to the right.
How it works
The chart lists the initiatives down the left-hand column. A timeline is displayed across the top. The bars to the right show the relative start and end dates of the initiatives.
Just to the left of the name of each initiative a small coloured symbol indicates the status of the initiative. You can hover over the symbols for more explanations. In short, blue symbols indicate initiatives which are on track, amber symbols indicate initiatives which may require some attention, and red symbols indicate initiatives which are in trouble.
The darkness of the shading of the bars indicates how confident you are in the start and duration estimates.
You can click on the name of any initiative to change the estimates and other information about the initiatives.
The initiatives can be grouped in themes. These themes are shown in bold. You can change the order in which the themes are displayed by dragging and dropping them. Initiatives within each theme are displayed in order of their start dates.
Before an initiative can appear on the Gantt chart it needs a start date and an estimated duration. Any initiatives without these will be displayed below the Gantt chart. To set a start date and duration, click on the initiative to open up the edit page. Then scroll down to "Do Next" and select "Add planning estimates". You can then enter a start date, duration estimate and estimate confidence level.
From the same screen, you can also select "Specify themes which this initiative is part of" and link the initiative to a theme.
What it's good for
The Gantt chart highlights two things:
- When your initiatives are planned to end. This is typically when your business will start to reap the benefits of the initiative. Most businesses monitor end dates and regularly review whether things are running ahead of or behind schedule. This can be an important part of your delivery teams' reward structures. End dates are also often communicated widely internally so that everyone knows what is going on and what they can expect when.
- When your initiatives are planned to start. There are two reasons why an initiative might not start right away:
- You can't do everything at once. If you try, you might find yourself stretched too thin. And then you might end up doing all of them badly. It is important to focus on doing only as many things at the same time as you can do well.
- You might not be able to start until something else happens. This may be an external event, such as a change in the law. Or it might be an internal event such as the completion of another initiative on which this one is dependent.
The Gantt chart is powerful in that it shows what you are going to do, even if you're not going to do it immediately.
