We use essential cookies to make this site work. With your permission, we also use optional cookies and similar technologies, including those from third parties, to understand, improve and personalise your experience.
Porter’s 5 Forces analysis data reveals a strong focus on buyer power, raising questions about gaps in industry attractiveness insights.
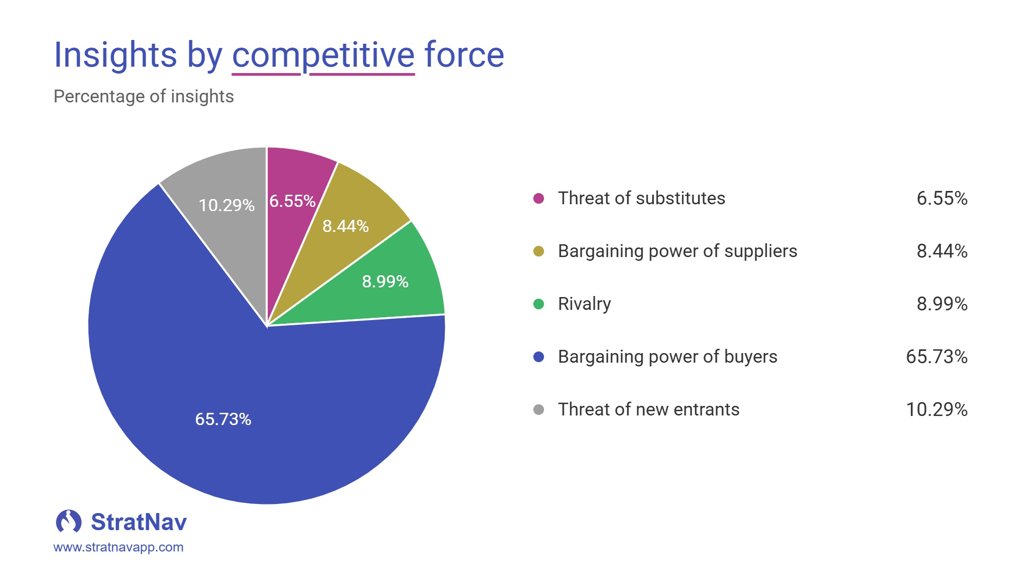
Our analysis of thousands of Porter's 5 Forces entries (as of 14/10/2026) shows the split of insights added per category:
Category
Percentage Of Insights
Threat of substitutes
6.55
Bargaining power of suppliers
8.44
Rivalry
8.99
Bargaining power of buyers
65.73
Threat of new entrants
10.29
TOTAL
100.00
Observations:
By far, the most number of insights (66%) are categorised as being related to the bargaining power of buyers. Does this represent a healthy focus on customers, or an unhealthy lack of insight into the other factors affecting industry attractiveness?
Notes:
This data is derived from thousands of strategic insights captured in StratNav and categorised using Porter's 5 Forces model.
Analysis is conducted programmatically: we have not looked at organisations' Porter's Five Forces Analysis.
Chris C Fox is an independent business strategy consultant and founder of StratNav. He helps consultants scale their impact, supports C-suite leaders in executing enterprise-wide strategies, and equips founders to grow and adapt with confidence.
👉 Learn more about Chris and his work.
👉 Book a strategy call or try StratNav for free.
Share this on:
LinkedInTwitterFacebookEmail
Every time you share anything about StratNav with someone else, you help them to develop and execute better business strategies, and you help to support us and our ability to continue to make the platform even better for you. So it really is a win-win!