Home > Articles > Frameworks
KPI Correlations: Using Data to Improve Strategy Execution Insights
Learn how KPI correlations help you track cause-and-effect in strategy execution and make better business decisions using StratNavApp.com.
Contents
 Are your KPIs telling the full story?
Tracking numbers is easy. But knowing how they connect is where strategy comes alive. KPI correlations can reveal whether your strategic actions are actually moving the needle.
They can also help you distinguish between good luck and good strategy.
KPI correlations help you understand the relationships between the KPIs so that you can confirm that changes to your strategic inputs are driving real change in your strategic outcomes.
This blog explains how.
Relationships between Strategic KPIs
A good set of strategic KPIs contains a mix of:
- leading and lagging indicators.
- indicators across the four perspectives of the Balanced Scorecard.
There are implied relationships between these strategic KPIs.
- Leading and lagging: a change in a leading indicator should be followed by a corresponding change in a related lagging indicator.
For example, an increase in marketing activity and/or sales enquiries (both leading indicators) should be followed by an increase in sales (a lagging indicator). - Balanced Scorecard: an improvement in a learning and growth indicator should lead to an improvement in one or more business process indicators, which should lead to an improvement in one or more customer indicators, which should lead to an improvement in one or more financial indicators.
For example, an increase in machine learning skills (a learning and growth indicator) should lead to faster/more accurate credit decisions (both business process indicators) which should lead to more and more satisfied customers (both customer indicators) which should lead to an increase in revenue (a financial indicator).
A good strategy is based on these cause-and-effect relationships between different goals, objectives and indicators.
If you're not seeing those relationships in your KPI results, then your strategy is not working. You'll want to understand why and fix it.
How to see if these relationships are working
But how do you see if they are working?
StratNavApp.com gives you two easy ways to analyse your KPIs and make data-driven decisions about your strategy:
- You can do a visual scan on your Results Scorecard (click Results on the Main Menu).
By default, all your charts share the same timeline on the x-axis, so you can quickly compare indicators and see if they move together.
This is fast, but it’s not always reliable, because patterns can be hard to spot by eye... so: - StratNavApp.com can calculate how closely your performance indicators move together using mathematical correlation (click the Correlation button on the top right-hand corner of the Scorecard).
Correlation is measured using the R² value:
"In statistics, the coefficient of determination, denoted R2 or r2 and pronounced 'R squared', is the proportion of the variance in the dependent variable that is predictable from the independent variable(s)." (Source: Wikipedia)
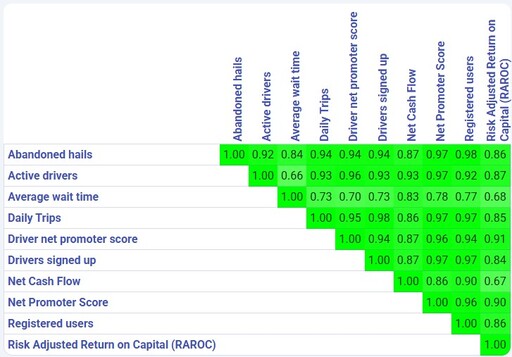 StratNavApp.com works out the R² for every pair of indicators, even testing what happens if one indicator moves 1, 2, or 3 months before the other. The results are shown in a table. Higher R² values (stronger correlations) are shaded darker green, and you can hover over any value to see how much delay (if any) was factored in.
This makes it easy to spot patterns and see whether your indicators support—or challenge—your assumptions about how your strategy is working.
NB: Correlation does not prove causation. But it is a factor you might consider in your KPI analysis.
What to do if your KPIs don't correlate
If your KPIs don't correlate, you should:
1. Check the Data Before Blaming the Strategy
-
Is the data accurate and consistent?
-
Look for gaps, inconsistent timeframes, or different definitions across teams.
-
For example, if “sales leads” are measured differently by marketing and sales, the correlation will be meaningless.
-
-
Are the KPIs measured at the right frequency?
-
A monthly KPI may not capture a weekly trend, creating a false disconnect.
-
2. Revisit Your Cause-and-Effect Assumptions
-
Are the KPIs truly linked?
-
Some “leading indicators” might not actually drive the outcomes you expect.
-
Example: More website visits (a common KPI) may not lead to revenue if those visitors aren’t in your target audience.
-
-
Test alternative drivers.
-
Use correlation analysis to see if other metrics (e.g., customer retention or conversion rates) show a stronger relationship.
-
3. Diagnose the Execution Problem
-
If your KPIs should correlate but don’t, it often means:
-
Initiatives aren’t being implemented effectively.
-
There’s a bottleneck (e.g., marketing generates leads, but sales doesn’t follow up).
-
External factors (competitors, economy) are overriding your strategy.
-
4. Adjust the Strategy or Tactics
-
If the relationship isn’t there, decide whether to:
-
Refine the KPIs (choose metrics that better reflect cause-and-effect).
- Review Goals and Objectives (choose goals and objectives that better reflect cause-and-effect).
-
Rework initiatives (focus efforts on levers that actually move outcomes).
-
Test and iterate — use StratNavApp to see if new initiatives create the expected correlations.
-
Where to find KPI correlations in StratNavApp
- Sign up or sign in to StratNavApp.
- Select the project you want to work with.
- Click "Results" on the Main Menu. This will take you to the Strategy Scorecard.
- Click the KPI correlations button () towards the top right of the screen.
Note: You will not be able to calculate correlations until you've built a strategy scorecard with enough performance data.
Conclusion
Most strategies fail not because they’re bad ideas, but because leaders can’t see what’s really driving results. StratNavApp uncovers those hidden links—so your strategy actually works.
Start tracking KPI correlations the smart way. Schedule a free demo or try StratNavApp.com free today and see the difference in your strategy execution.
See also:
- Maximising Strategic Impact with KPIs: A Guide
- How KPIs Bring Your Strategy to Life
- Using numbers in your strategy
- Goals, objectives, KPIs, targets, initiatives and actions
